[Series: The Uncomfortable Truths of the Hawaii Economy]
- Chapter 1: Is Resentment Toward Tourism an Act of Economic Self-Harm?
- Chapter 2: The Illusion of Industrial Diversification — Inside the “Death Trap” of Structural Costs (Current Article)
- Chapter 3: An Analysis of the Labor Structure — The Fragility of “Pseudo-Capitalism”
- Chapter 4: The Path to Resilient Symbiosis — Protecting Our “Engine” to Build Our Future
- Chapter 5: Implementation Roadmap — Strategic Integration of the “Green Fee” and Local Resilience
“Through my daily tour operations, I stand at the intersection of Hawaii’s natural environment, its visitors, and our local community. What I witness there is a profound, lived pain among residents, which has led to a tragic divide—a ‘misunderstanding of tourism.’ I have authored this report as a first step toward bridging that gap.”
Chapter 4: The Path to Resilient Symbiosis — Protecting Our “Engine” to Build Our Future
1. Deconstructing the “Economic Ischemia”: The 99% vs. 0.7% Disconnect
The fundamental instability of Hawaii’s economy stems from a profound mismatch between those who sustain local employment and those who capture the majority of the revenue. Based on the U.S. Census Bureau’s Economic Census and DBEDT data, the structural reality of Hawaii’s private sector is a pyramid of extreme concentration.
Exhibit 4.1: The Revenue-Employment Paradox in Hawaii (2023-2024)

The data reveals a “Pseudo-Capitalist” trap: while small businesses serve as the backbone of the local community, more than half of the wealth is monopolized by a fragment of large-scale, often off-island, entities. Furthermore, applying the UNWTO “Leakage Model” to Hawaii’s island economy, it is estimated that 70% to 80% of every dollar spent at these large institutions (airlines, global hotel chains, and OTAs) exits the state immediately as corporate profits, management fees, and import costs.
2. The “Regressive Nature” of Mālama Hawaiʻi: How Regulation Accelerates Consolidation
Current “Tourism Management” policies, though well-intentioned, harbor a statistically regressive bias that inadvertently penalizes local entrepreneurs.
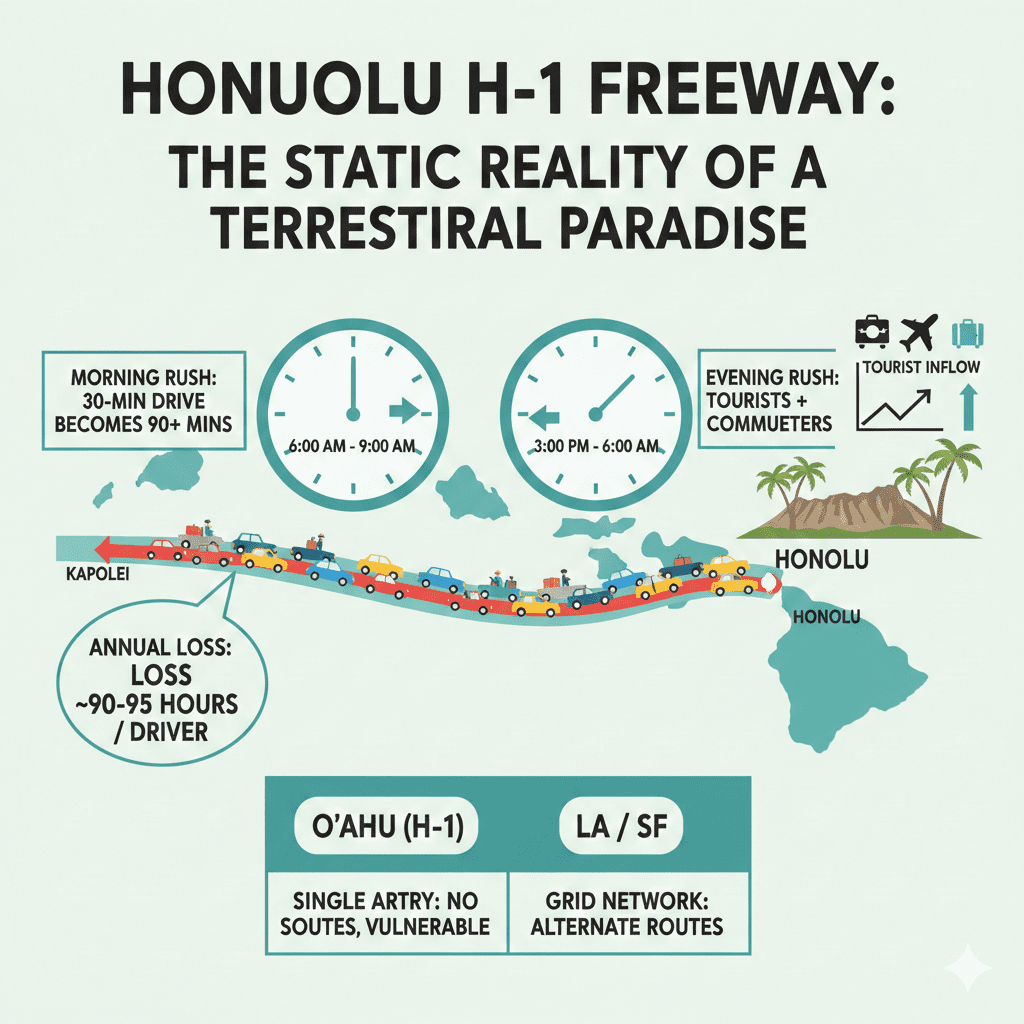
- Compliance as a Fixed Cost: Regulations such as mandatory reservation systems and complex environmental certifications represent a negligible “fixed cost” for large corporations. However, for a small operator like Wildlife Hawaii, these costs consume a significant percentage of net operating income.
- Barriers to Entry and “Economic Castration”: When the state limits permits under the guise of “over-tourism management,” it effectively protects the incumbency of large existing players while stifling the entry of local innovators.
- The Risk of Community Vacancy: If the profitability of the small business sector—which holds 50% of all private jobs—is compressed by an additional 5-10% due to regulatory overhead, we risk a “hollowing out” effect. The result is a dystopia: pristine, well-manicured resorts surrounded by economically decaying local communities.
Exhibit 4.2: The Leakage Effect and Wealth Outflow in Hawaii’s Tourism Sector
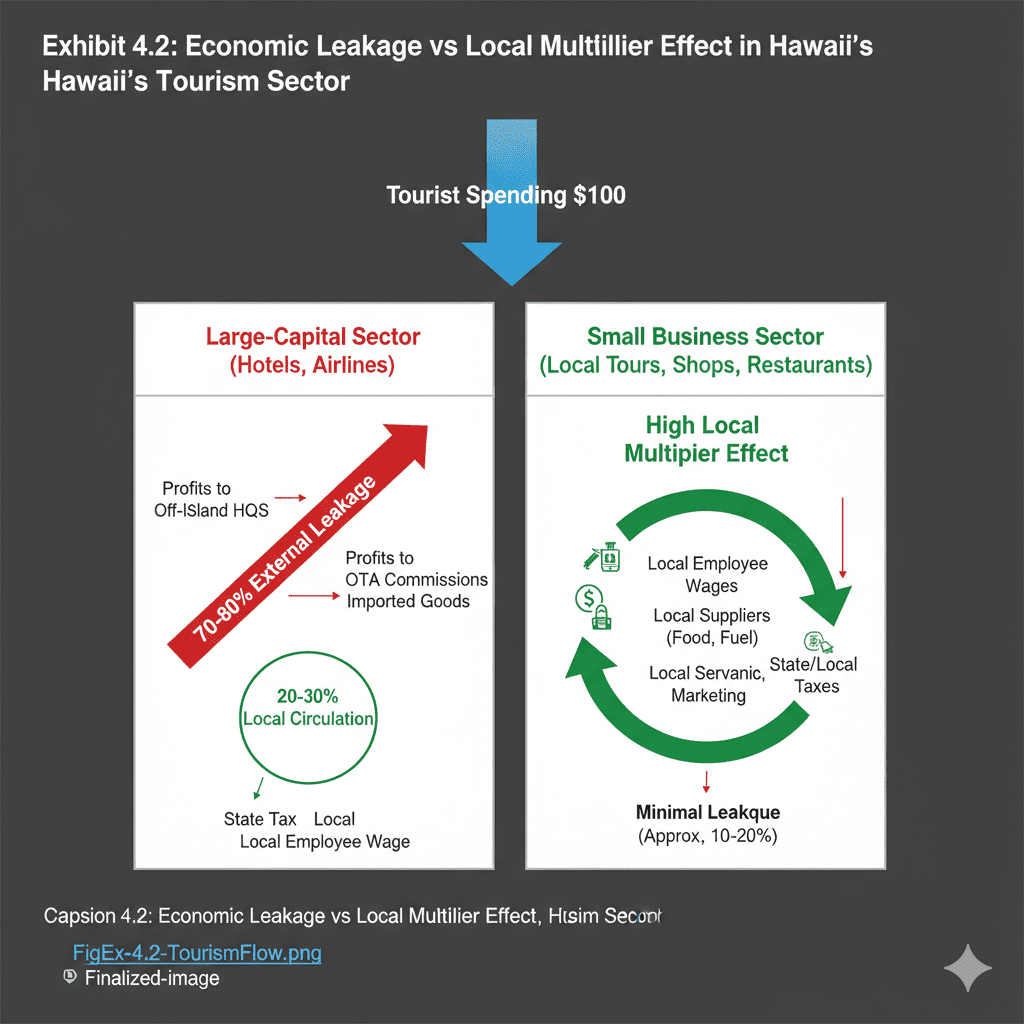
Exhibit 4.2: Economic Leakage vs. Local Multiplier Effect. This diagram illustrates the divergent paths of tourism revenue based on business scale and ownership. In the Large-Corporate Sector (major hotels, airlines, and OTAs), an estimated 70-80% of revenue exits the state through “External Leakage” (repatriation of profits to global headquarters) and “Internal Leakage” (procurement of imported goods).
In sharp contrast, the Small Business Sector demonstrates a significantly higher Local Multiplier Effect. By sourcing labor, services, and supplies locally, small businesses ensure that tourism dollars circulate within the community multiple times, generating a deeper and more resilient secondary economic impact per dollar spent compared to large-scale, off-island entities.
3. Policy Proposal: A Reinvestment Model for “Economic Muscle”
To move beyond the irony that “everyone should just work for a large corporation,” Hawaii must implement mechanisms that leverage the capital of large entities to strengthen the “muscles” of the local small business sector.
I. The “Small Business Capital Fund” (Reforming TAT Allocation)
A portion of the $880M in annual Transient Accommodations Tax (TAT) currently diverted to the General Fund should be ring-fenced as a “Local Entrepreneurship & Innovation Fund.”
- Logic: Use the tax revenue generated by visitors at large hotels to provide low-interest loans and DX (Digital Transformation) grants directly to the small businesses that provide the “authentic” experiences visitors seek.
II. Incentivizing the Local Supply Chain
Using DBEDT’s Input-Output (I-O) models as a baseline, the state should implement tiered corporate tax credits for large resorts that exceed 15-20% local procurement thresholds.
- Impact: This creates a financial “blood flow” from the bloated corporate heart to the local capillaries (farmers, local tour operators, and artisans).
III. Tourism as an “Incubator” for New Industries
Tourism is our only significant engine of “Fresh Water” (external revenue). This revenue must be strategically deployed into STEM education and risk capital for local youth.
- Goal: To break the 41% dependency on the public sector (identified in Chapter 3) by building a private sector that is resilient, technologically advanced, and locally owned.
4. Conclusion: Resilient Symbiosis — The Only Path to Dignity
The value of Hawaii does not lie in the wallpaper of a managed resort. It lies in the living culture, the aloha spirit, and most importantly, in the dignity of residents who own and operate their own land and businesses.
We must not destroy our primary engine out of resentment. Instead, we must master it. By forcing a portion of the wealth captured by global capital back into the hands of the 99% of local businesses, we achieve “Resilient Symbiosis.”
When a visitor looks out of a resort window, they should see a thriving local economy, not a hollowed-out theme park. Protecting the “engine” while strengthening the “body” is the only way to ensure that Hawaii remains not just a destination, but a proud, self-sustaining home for the generations to come.
Appendix: Methodology, Definitions, and Statistical Foundations
This report utilizes a cross-disciplinary analytical framework combining macroeconomics, industrial organization, and regional economic modeling to ensure the integrity of its findings.
1. Definitions of Key Terms
A. Economic Leakage
Defined as the portion of tourist expenditure that exits the local economy. This report accounts for two primary forms of leakage:
- External Leakage: Repatriation of profits, management fees, and commissions by off-island entities (e.g., global hotel chains, major airlines, and OTAs).
- Internal Leakage: The cost of importing goods (food, fuel, equipment) required to sustain the tourism industry.
- Methodological Basis: Derived from the UNWTO “Tourism Leakage Model” specifically calibrated for island economies with high import dependency.
B. Small Business
Defined in accordance with the U.S. Small Business Administration (SBA) and the Hawaii Department of Business, Economic Development & Tourism (DBEDT).
- Statistical Definition: Firms with fewer than 500 employees.
- Contextual Definition: In Hawaii, over 85% of these are “Micro-businesses” with fewer than 20 employees. This report focuses on these entities as the primary drivers of community-based economic circulation.
C. Economic Ischemia
A term introduced in this report to describe a condition where revenue is concentrated in a few large capital organs (Large Corporations), resulting in a failure of “monetary blood flow” to the capillaries (Small Businesses and Local Households).
2. Statistical Framework and Calculation Methods
The following data sources and analytical tools were utilized to prevent arbitrary estimation:
I. Firm and Employment Distribution
- Source: 2023 Small Business Profile (Hawaii), U.S. Small Business Administration (SBA).
- Logic: The figure of “99.3% of firms employing 50.2% of the workforce” is an established census-level fact for Hawaii.
II. Revenue Concentration (58% vs. 42% Split)
- Source: 2017/2022 Economic Census (U.S. Census Bureau) and DBEDT Quarterly Statistical & Economic Reports.
- Calculation Method: Total revenue was bifurcated by NAICS codes. Revenue from Accommodations (721) and Air Transportation (481) was categorized as “Large-Capital Dominated” based on ownership concentration, while Food Services, Retail, and Arts/Entertainment were adjusted for Small Business shares.
III. Leakage Rate (70-80%)
- Source: Hawaii Input-Output (I-O) Model, DBEDT Research and Economic Analysis Division.
- Analytical Tool: The “Import Interdependency” and “Operating Surplus” ratios within the DBEDT I-O table were analyzed. The high leakage is a theoretical necessity given that 65% of spending occurs in sectors where profits are repatriated and over 90% of physical goods are imported.
References
Department of Business, Economic Development & Tourism (DBEDT). (2024). The Hawaii input-output model: 2017 benchmark report. State of Hawaii Research and Economic Analysis Division.
Department of Business, Economic Development & Tourism (DBEDT). (2025). Quarterly statistical and economic report (QSER). State of Hawaii.
Hawaii Tourism Authority (HTA). (2024). Resident sentiment survey: Annual report. State of Hawaii.
Sasaki, M. (2026). Wildlife Hawaii: Strategic roadmap for tour content revision and economic sustainability. [Internal Business Report].
U.S. Census Bureau. (2022). Economic census: Hawaii state profile. U.S. Department of Commerce.
U.S. Small Business Administration (SBA). (2023). Small business profile: Hawaii. Office of Advocacy.
United Nations World Tourism Organization (UNWTO). (2022). Compendium of tourism statistics: Economic leakage in small island developing states (SIDS). UNWTO Publications.
World Bank. (2023). Tourism-led growth and its limitations in insular economies. World Bank Research Department.
Transition to Chapter 5: From Diagnosis to Prescription
The statistical evidence presented in Chapter 4 paints a sobering picture of Hawaii’s current trajectory: a hollowed-out economy where 99.3% of local businesses fight for a diminishing share of wealth while 70-80% of major revenue leaks out of the state. To ignore these structural flaws is to accept the inevitable decay of our community’s resilience.
However, this “Economic Ischemia” is not a terminal condition. It is a systemic failure that can be corrected through bold, targeted policy intervention.
In the following final chapter, we move from diagnosis to prescription. Leveraging the strategic window provided by the newly implemented 2026 “Green Fee,” we will outline a concrete roadmap for a “Resilient Symbiosis.” We will propose a mechanism to divert global capital back into local capillaries, ensuring that the engine of Hawaii’s economy finally fuels the people who keep it running.
[Series: The Uncomfortable Truths of the Hawaii Economy]
- Chapter 1: Is Resentment Toward Tourism an Act of Economic Self-Harm?
- Chapter 2: The Illusion of Industrial Diversification — Inside the “Death Trap” of Structural Costs (Current Article)
- Chapter 3: An Analysis of the Labor Structure — The Fragility of “Pseudo-Capitalism”
- Chapter 4: The Path to Resilient Symbiosis — Protecting Our “Engine” to Build Our Future
- Chapter 5: Implementation Roadmap — Strategic Integration of the “Green Fee” and Local Resilience